
Turn on suggestions
Auto-suggest helps you quickly narrow down your search results by suggesting possible matches as you type.
Showing results for
Turn on suggestions
Auto-suggest helps you quickly narrow down your search results by suggesting possible matches as you type.
Showing results for
Community Tip - Your Friends List is a way to easily have access to the community members that you interact with the most! X
- Community
- ThingWorx
- ThingWorx Developers
- Date Display on Time Series chart
Options
- Subscribe to RSS Feed
- Mark Topic as New
- Mark Topic as Read
- Float this Topic for Current User
- Bookmark
- Subscribe
- Mute
- Printer Friendly Page
Date Display on Time Series chart
Aug 13, 2016
06:21 AM
- Mark as New
- Bookmark
- Subscribe
- Mute
- Subscribe to RSS Feed
- Permalink
- Notify Moderator
Aug 13, 2016
06:21 AM
Date Display on Time Series chart
My x axis date display format has been changed to MMM-dd
But my problem is that my service clauclate the min and max value of Temperature in a day continously and it display the data as shown below
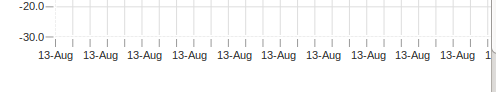
But my need is that i want to display the data on daily basis as shown belo
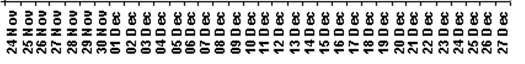
Note : each x axis label is each day
Please help how to get it done
1 REPLY 1
Aug 15, 2016
10:34 AM
- Mark as New
- Bookmark
- Subscribe
- Mute
- Subscribe to RSS Feed
- Permalink
- Notify Moderator
Aug 15, 2016
10:34 AM
Hi Sin,
I believe I saw it answered here in the Community: you can use the Label Chart Widget and create a data table that has 3 columns: date/Max/Min.
If I understood your case correctly, with that you can select the date as the X axis.
Cheers
Ewerton


