
Turn on suggestions
Auto-suggest helps you quickly narrow down your search results by suggesting possible matches as you type.
Showing results for
Turn on suggestions
Auto-suggest helps you quickly narrow down your search results by suggesting possible matches as you type.
Showing results for
Community Tip - Visit the PTCooler (the community lounge) to get to know your fellow community members and check out some of Dale's Friday Humor posts! X
- Community
- ThingWorx
- ThingWorx Developers
- Re: Why timestamp variation on x axis in time seri...
Options
- Subscribe to RSS Feed
- Mark Topic as New
- Mark Topic as Read
- Float this Topic for Current User
- Bookmark
- Subscribe
- Mute
- Printer Friendly Page
Why timestamp variation on x axis in time series chart by using value stream?
Apr 27, 2017
06:32 AM
- Mark as New
- Bookmark
- Subscribe
- Mute
- Subscribe to RSS Feed
- Permalink
- Notify Moderator
Apr 27, 2017
06:32 AM
Why timestamp variation on x axis in time series chart by using value stream?
Dear Team,
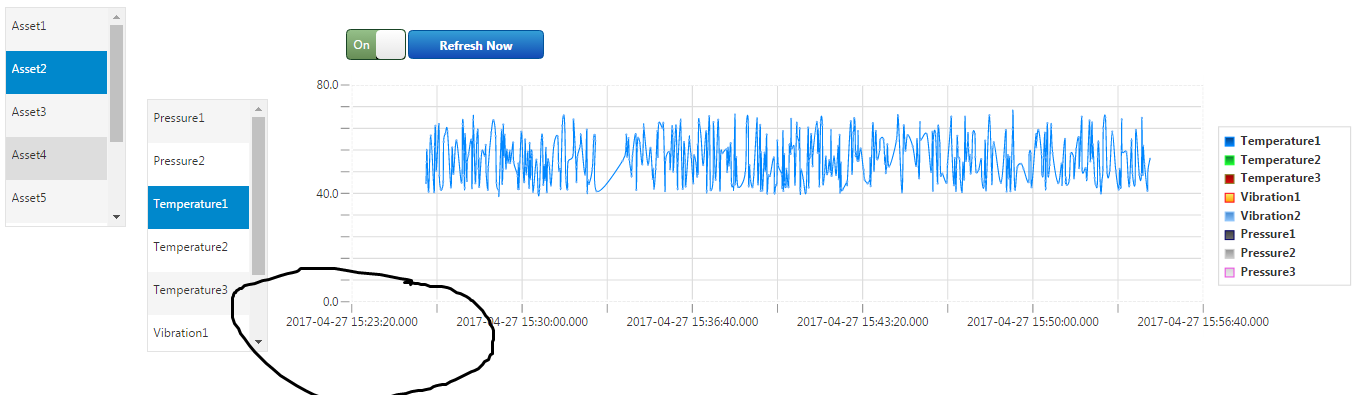
Why timestamp variation on x axis in time series chart by using value stream? I need to show fixed inertval in time series chart
Image: 1 starting time stamp 15:10:23
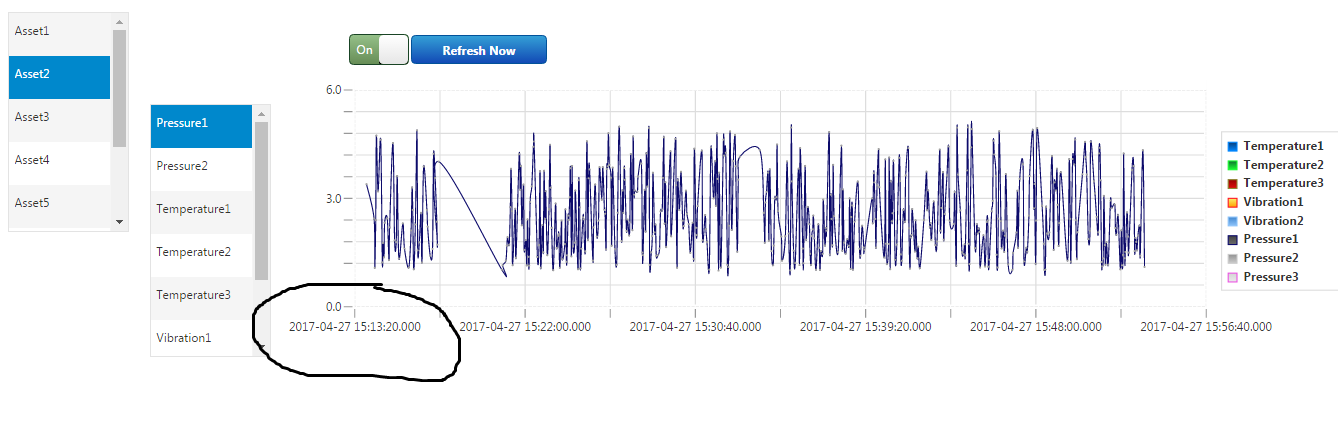
Image: 2 starting time stamp 15:13:23
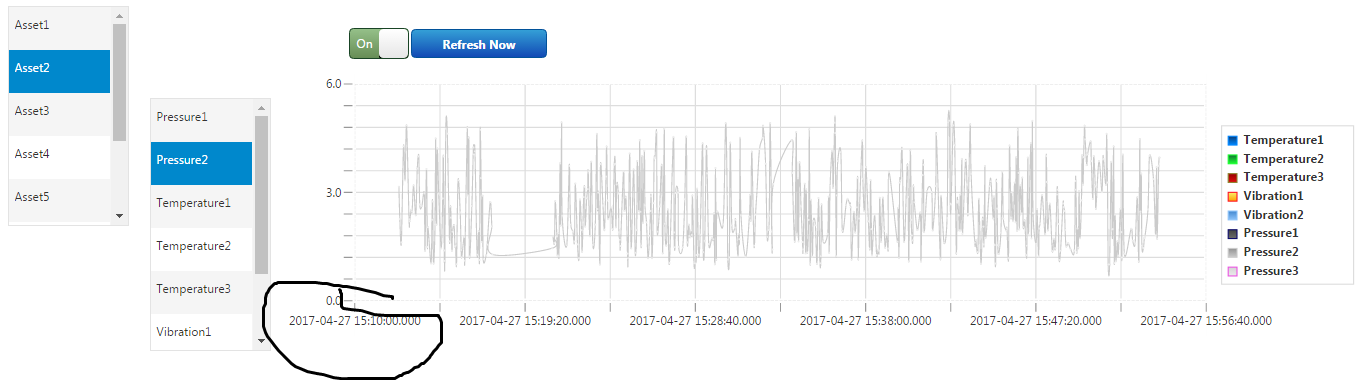
Image:3 starting time stamp 15:23:55
I need to show fixed start time and end time for all properties.
Labels:
- Labels:
-
Mashup-Widget
- Tags:
- mashups
6 REPLIES 6
Apr 27, 2017
06:44 AM
- Mark as New
- Bookmark
- Subscribe
- Mute
- Subscribe to RSS Feed
- Permalink
- Notify Moderator
Apr 27, 2017
06:44 AM
Hi Bhuwaneshwar, is the minimum and maximum for the X axis configured for the timeseries chart widget? 
if not could you set these and test
Apr 27, 2017
07:11 AM
- Mark as New
- Bookmark
- Subscribe
- Mute
- Subscribe to RSS Feed
- Permalink
- Notify Moderator
Apr 27, 2017
07:11 AM
Hi Sushant,
That is not working. I need to show value from current time stamp to previous 1 hour.
Apr 27, 2017
07:26 AM
- Mark as New
- Bookmark
- Subscribe
- Mute
- Subscribe to RSS Feed
- Permalink
- Notify Moderator
Apr 27, 2017
07:26 AM
You can bind the values to those parameters as it's accepting incoming binds, basically you can have two values one picking up the current system time and then just subtract an hour from that an add to the other value. Have you already tried that as well?
Apr 30, 2017
03:48 AM
- Mark as New
- Bookmark
- Subscribe
- Mute
- Subscribe to RSS Feed
- Permalink
- Notify Moderator
Apr 30, 2017
03:48 AM
Hi Sushant,
I encounter this same scenario as I wanted to have the start time in x-axis adjusting based on current time stamp.
I have bound the current time stamp to "XAxisMaximum". My confusion is in the "XAxisMinimum".
How do I subtract a value from the current time stamp?
Is there an operation I can do in either the properties or on the bindings? Or I need to create another parameter for this.
Apr 27, 2017
08:09 AM
- Mark as New
- Bookmark
- Subscribe
- Mute
- Subscribe to RSS Feed
- Permalink
- Notify Moderator
Apr 27, 2017
08:09 AM
Hi Sushant,
As you said way working but auto refresh is not working. I need chart to be autorefresh and show only one hour data.
Apr 27, 2017
09:26 AM
- Mark as New
- Bookmark
- Subscribe
- Mute
- Subscribe to RSS Feed
- Permalink
- Notify Moderator
Apr 27, 2017
09:26 AM
You can use the Auto Refresh widget in the mashup (you can disable its visibility if not needed) which has a refresh event which is fired when the Auto Refresh widget refreshes you can use the event to invoke the service which is setting your current date and current date - 1hour to the Time Series chart.
Hope this helps.


