
Turn on suggestions
Auto-suggest helps you quickly narrow down your search results by suggesting possible matches as you type.
Showing results for
Turn on suggestions
Auto-suggest helps you quickly narrow down your search results by suggesting possible matches as you type.
Showing results for
Community Tip - Have a PTC product question you need answered fast? Chances are someone has asked it before. Learn about the community search. X
- Community
- ThingWorx
- ThingWorx Developers
- Re: creating charts from the grid data
Options
- Subscribe to RSS Feed
- Mark Topic as New
- Mark Topic as Read
- Float this Topic for Current User
- Bookmark
- Subscribe
- Mute
- Printer Friendly Page
creating charts from the grid data
Sep 10, 2017
01:08 PM
- Mark as New
- Bookmark
- Subscribe
- Mute
- Subscribe to RSS Feed
- Permalink
- Notify Moderator
Sep 10, 2017
01:08 PM
creating charts from the grid data
Created by Mahaboob Basha on Sep 7, 2017 7:21 AM. Last modified by Mahaboob Basha on Sep 7, 2017 7:21 AM.
Version 1
Hello,
Am sending the json data through the Post method via rest API URL and it is displaying on grid by using getDataTabeEntries service. now i want to create a chart by using two columns of data from the grid on the mashup. but am unable to create anytype of chart by using that data.
i want to show the values chart of sensor value of a temperature and timestamp .
can anybody please help me out?
Labels:
- Labels:
-
Mashup-Widget
- Tags:
- services
9 REPLIES 9
Sep 11, 2017
04:17 AM
- Mark as New
- Bookmark
- Subscribe
- Mute
- Subscribe to RSS Feed
- Permalink
- Notify Moderator
Sep 11, 2017
04:17 AM
Please try to elaborate more.
Are you trying to use time series chart?
Make sure you are binding the data to the correct place in the chart - data source.
Please add screenshots, it can help.
Sep 11, 2017
05:52 AM
- Mark as New
- Bookmark
- Subscribe
- Mute
- Subscribe to RSS Feed
- Permalink
- Notify Moderator
Sep 11, 2017
05:52 AM
Hello Assaf Elgov,
Thanks a lot for reply
I have attached the screen shots,
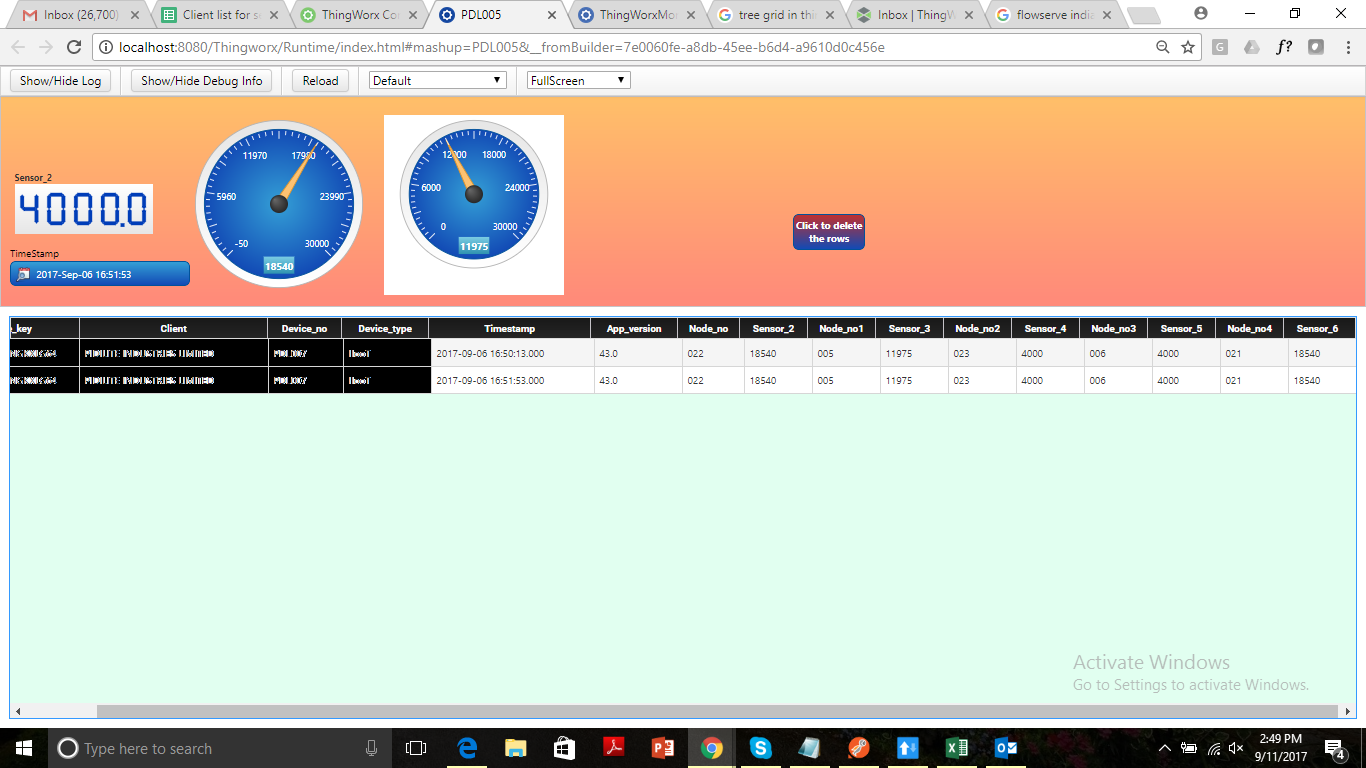
1 screen shot : The data is displayed on the grid, from that grid i want show the timestamp and sensor_2 value on the graph.
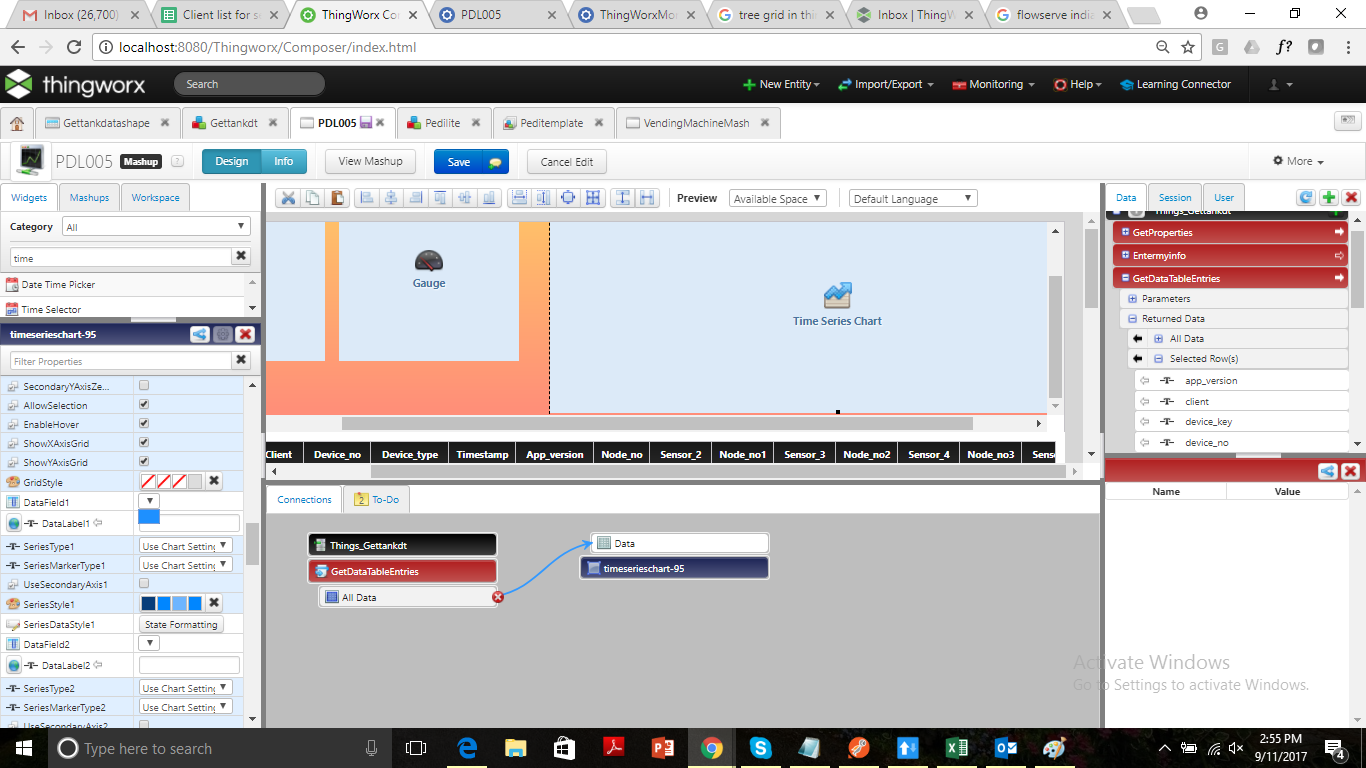
2. screenshot : I have bind the data and you can able to see the connection also from the getDatatableEntries service. and in the property configuration, i can able to see only the time stamp field in x- axis but no other fields in the the data fields of y-axis
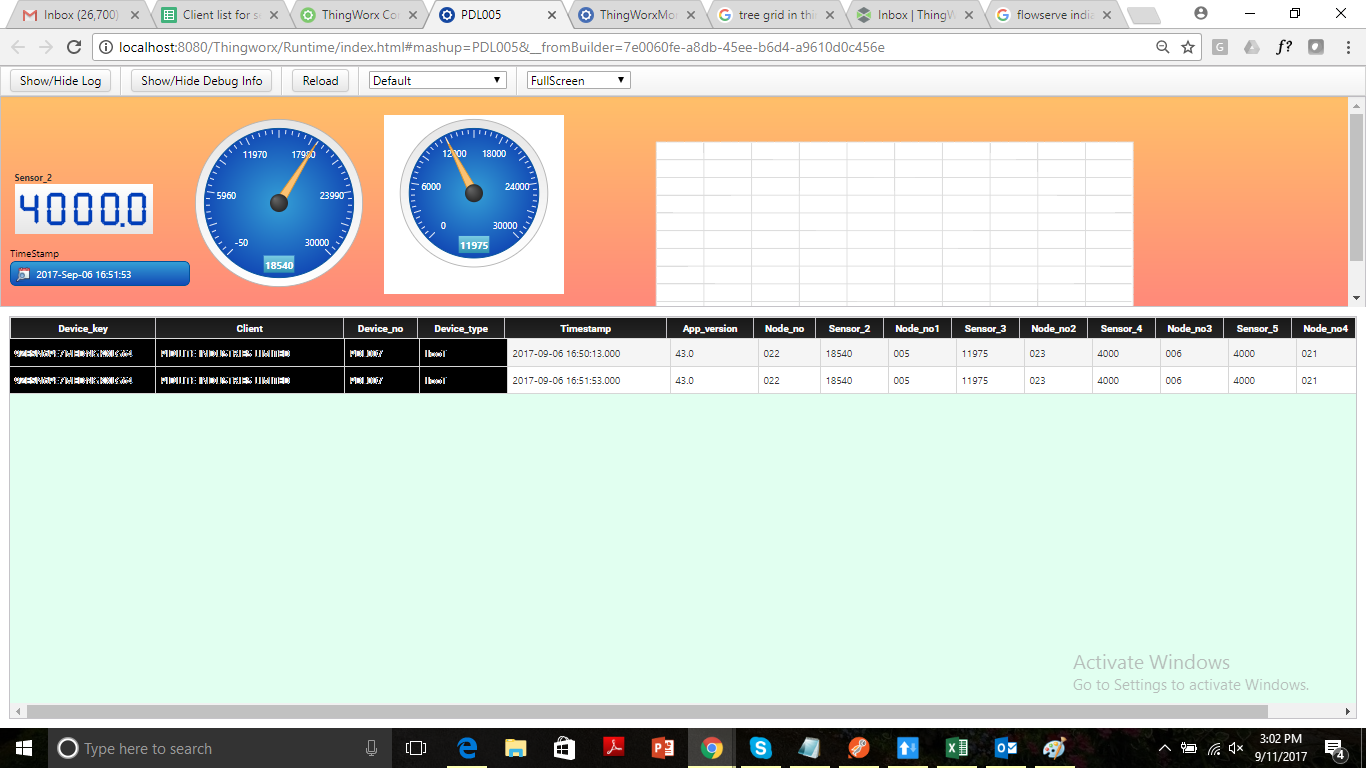
3 screen shot : i get empty graph with no single value.
Sep 11, 2017
06:04 AM
- Mark as New
- Bookmark
- Subscribe
- Mute
- Subscribe to RSS Feed
- Permalink
- Notify Moderator
Sep 11, 2017
06:04 AM
Please specify in the service data shape for the infotable, then try to drag again, you should have options in the list
Sep 11, 2017
06:30 AM
- Mark as New
- Bookmark
- Subscribe
- Mute
- Subscribe to RSS Feed
- Permalink
- Notify Moderator
Sep 11, 2017
06:30 AM
My service returns the output nothing.
Sep 11, 2017
06:31 AM
- Mark as New
- Bookmark
- Subscribe
- Mute
- Subscribe to RSS Feed
- Permalink
- Notify Moderator
Sep 11, 2017
06:31 AM
i have defined the output to my service is "nothing".
I tried for the infotable also but its not working.
Sep 11, 2017
06:55 AM
- Mark as New
- Bookmark
- Subscribe
- Mute
- Subscribe to RSS Feed
- Permalink
- Notify Moderator
Sep 11, 2017
06:55 AM
You need the output type to be infotable and also to set the data shape according to the data you are returning.
Sep 11, 2017
07:00 AM
- Mark as New
- Bookmark
- Subscribe
- Mute
- Subscribe to RSS Feed
- Permalink
- Notify Moderator
Sep 11, 2017
07:00 AM
this is my service code, when i send the data through rest API, my data will directly display on the grid on mashup. as you said i have put output to infotable and added data shape also.
var values = Things["Gettankdt"].CreateValues();
values.device_key = jsonData.device_key; //STRING
values.app_version = jsonData.app_version; //STRING
values.sensor_2 = jsonData.nodes[0].sensor_2; //STRING
values.sensor_3 = jsonData.nodes[1].sensor_2;
values.sensor_4 = jsonData.nodes[2].sensor_2;
values.sensor_5 = jsonData.nodes[3].sensor_2;
values.sensor_6 = jsonData.nodes[4].sensor_2;
values.client = jsonData.client; //STRING
values.node_no = jsonData.nodes[0].node_no;//STRING [Primary Key]
values.node_no1 = jsonData.nodes[1].node_no;
values.node_no2 = jsonData.nodes[2].node_no;
values.node_no3 = jsonData.nodes[3].node_no;
values.node_no4 = jsonData.nodes[4].node_no;
values.device_no = jsonData.device_no; //STRING
values.device_type = jsonData.device_type; //STRING
values.timestamp = jsonData.timestamp; //NUMBER
values.timestamp = values.timestamp *1000;
me.timestamp = values.timestamp;
me.sensor_2 = values.sensor_2;
me.sensor_3 = values.sensor_3
me.sensor_4 = values.sensor_4
me.sensor_5 = values.sensor_5
me.sensor_6 = values.sensor_6
var params = {
values : values,
};
var id = Things["Gettankdt"].AddOrUpdateDataTableEntry(params);
var params = {
infoTableName : "InfoTable",
dataShapeName : "Gettankdatashape"
};
// CreateInfoTableFromDataShape(infoTableName:STRING("InfoTable"), dataShapeName:STRING):INFOTABLE(Gettankdatashape)
var result = Resources["InfoTableFunctions"].CreateInfoTableFromDataShape(params);
Sep 11, 2017
07:02 AM
- Mark as New
- Bookmark
- Subscribe
- Mute
- Subscribe to RSS Feed
- Permalink
- Notify Moderator
Sep 11, 2017
07:02 AM
Can you take screen shot of the service output ?
Sep 11, 2017
07:28 AM
- Mark as New
- Bookmark
- Subscribe
- Mute
- Subscribe to RSS Feed
- Permalink
- Notify Moderator


