
Turn on suggestions
Auto-suggest helps you quickly narrow down your search results by suggesting possible matches as you type.
Showing results for
Turn on suggestions
Auto-suggest helps you quickly narrow down your search results by suggesting possible matches as you type.
Showing results for
Community Tip - Did you get an answer that solved your problem? Please mark it as an Accepted Solution so others with the same problem can find the answer easily. X
- Community
- PTC Education
- PTC Education Forum
- Re: how can i interpolate x values and y values on...
Options
- Subscribe to RSS Feed
- Mark Topic as New
- Mark Topic as Read
- Float this Topic for Current User
- Bookmark
- Subscribe
- Mute
- Printer Friendly Page
how can i interpolate x values and y values on the chart
Aug 10, 2016
09:37 AM
- Mark as New
- Bookmark
- Subscribe
- Mute
- Subscribe to RSS Feed
- Permalink
- Notify Moderator
Aug 10, 2016
09:37 AM
how can i interpolate x values and y values on the chart
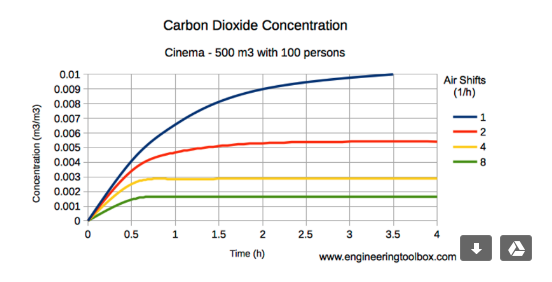
for example i have shown the figure
How can i plot such graphs
i have calculated all the parameters required for this
Please and kindly help
Labels:
- Labels:
-
Thingworx for Universities
2 REPLIES 2
Aug 10, 2016
10:12 AM
- Mark as New
- Bookmark
- Subscribe
- Mute
- Subscribe to RSS Feed
- Permalink
- Notify Moderator
Aug 10, 2016
10:12 AM
Hi Sruchan,
You need to use the TimeSeries Chart. In order to use it you need a service that returns an Infotable that has at least one NUMBER and one TIMEDATE fields.
You may want to refer to the Tutorial: Advanced Chart Widgets Tutorial - YouTube
Cheers
Ewerton
Aug 15, 2016
10:13 AM
- Mark as New
- Bookmark
- Subscribe
- Mute
- Subscribe to RSS Feed
- Permalink
- Notify Moderator
Aug 15, 2016
10:13 AM
How to make plotting as curve as that in the above chart
what is the best chart to use to represent as the above chart
